PCA Analysis
-
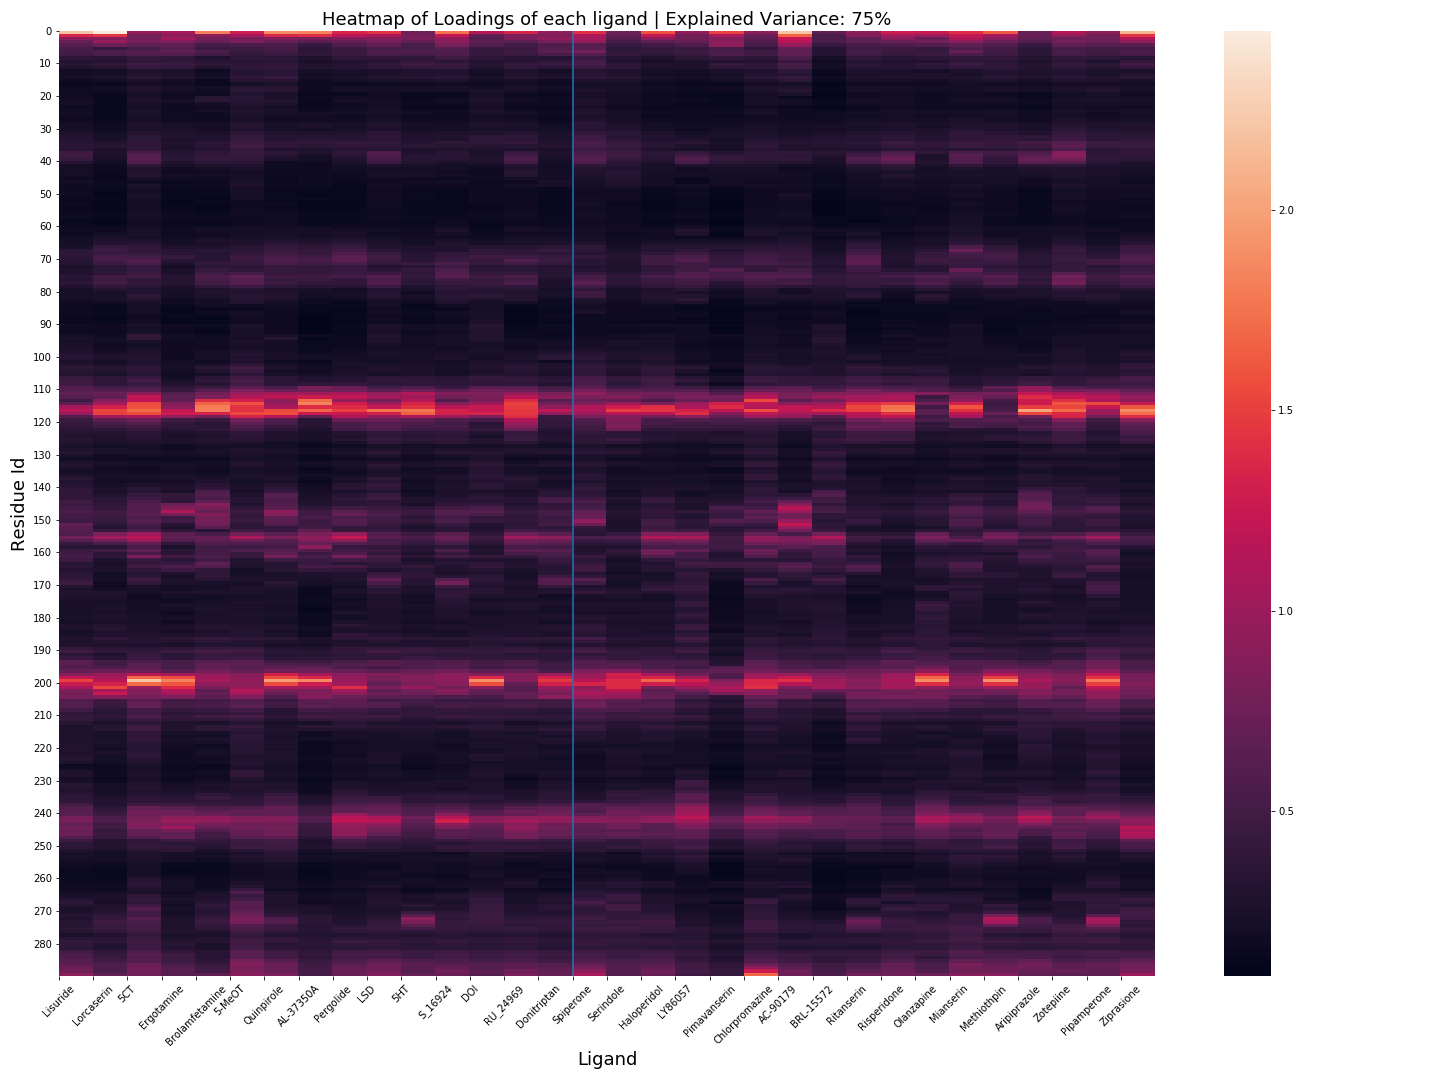
MDSimsEval.pca_analysis.loadings_heatmap(analysis_actors_dict, dir_path, explained_variance=0.75)¶ - Creates a heatmap of the loadings of the residues for all the ligands. The blue line separates Class 1 fromClass 2

PCA Loadings Heatmap, click for higher resolution.
- Parameters
analysis_actors_dict –
{ "Agonists": List[AnalysisActor.class], "Antagonists": List[AnalysisActor.class] }dir_path (str) – The path of the directory the plot will be saved (must end with a
/)explained_variance (float 0.0 - 1.0) – Defines the number of PCs that will be used for the loadings calculation
-
MDSimsEval.pca_analysis.populate_variance_showcase_df(analysis_actors_dict, drug_type)¶ Creates a DataFrame having for each drug the number of PCs needed in order to have 50%, 75% and 95% variance
- Parameters
analysis_actors_dict –
{ "Agonists": List[AnalysisActor.class], "Antagonists": List[AnalysisActor.class] }drug_type (str) – The class name (‘Agonists’ or ‘Antagonists’)
- Returns
A DataFrame with columns
['Drug Name', 'Type', '50% Variance', '75% Variance', '95% Variance']- Return type
pd.DataFrame
-
MDSimsEval.pca_analysis.project_pca_on_2d(analysis_actors_dict, drug_type, dir_path)¶ Plots the 2d projection on the first two PCs of the atom space. The colorbar expresses the progression of the frames (color0 -> frame0, color1 -> last_frame). The plot is shown inside the function but if need can be easily be changed to return it.
- Parameters
analysis_actors_dict –
{ "Agonists": List[AnalysisActor.class], "Antagonists": List[AnalysisActor.class] }drug_type (str) – ‘Agonists’ or ‘Antagonists’
dir_path (str) – The path of the directory the plot will be saved (must end with a
/)
-
MDSimsEval.pca_analysis.scree_plot(analysis_actors_dict, dir_path, pcs_on_scree_plot=50, variance_ratio_line=0.75)¶ Creates a plot with the scree plots for each ligand and saves it on the specified
dir_path. With blue color is class 1 and with orange color class 2.- Parameters
analysis_actors_dict –
{ "Agonists": List[AnalysisActor.class], "Antagonists": List[AnalysisActor.class] }dir_path (str) – The path of the directory the plot will be saved (must end with a
/)pcs_on_scree_plot (int) – The number of the first PCs that will be used on the scree plots
variance_ratio_line (float) – Float from 0.0 to 1.0 which specifies the variance ratio that a vertical line will
plotted (be) –
-
MDSimsEval.pca_analysis.sort_residues_by_loadings(ligand, variance_explained=0.5)¶ Having as an input a ligand find the loadings of each residue and return them in descending order. The method combines first k PCs where k is defined by the variance_explained argument.
- Parameters
ligand (AnalysisActor.class) – An AnalysisActor object in which PCA is calculated
variance_explained (float) – Defines which PCs will be combined to calcualte the final loadings
- Returns
pd.DataFrame where ResidueId is the index and each row contains the loadings of the residue