5. RMSF Analysis
RMSF is a measure of the deviation of the position of a particle i with respect to a reference position over time.
Difference between RMSD and RMSF: The latter is averaged over time, giving a value for each particle i. For the RMSD the average is taken over the particles, giving time specific values. So RMSD is time specific and RMSF is atom specific (ref).
This module aims on finding which are the most differentiating residues of the two classes based on their RMSF. To achieve that I followed two paths:
Top and High RMSF Analysis, which is a more simplistic and prone to overfitting approach
Bootstrapped RMSF Analysis (recommended), which is more complex and time consuming but more robust to the results it gives
5.1. Top and High RMSF Analysis
We define as High-k, the k residues that had the highest RMSF on their respective class. This creates two lists of residues, one for each class.
We define as Top-k, the k residues that had the biggest abs(high_k_class1 - high_k_class2).
-
MDSimsEval.rmsf_analysis.corr_matrix(analysis_actors_dict, method='pearson', top=290, start=0, stop=2500)¶ Creates a correlation matrix of the RMSF which has
#agonists + #antagonists x #agonists + #antagonistsdimensions. The correlation values are calculated on the RMSF values of thetop-kresidues. On the output DataFrame the ligand names have only their first 5 characters for visual reasons.The result is not in a readable format and could be passed in
MDSimsEval.utils.render_corr_df.Warning
This method should be deleted / refactored. I suggest using
MDSimsEval.rmsf_bootstrapped_analysis.create_correlation_df- Parameters
analysis_actors_dict –
{ "Agonists": List[AnalysisActor.class], "Antagonists": List[AnalysisActor.class] }method (str) – pearson, kendall, spearman
top (int) – The top-k residues that will be used for the correlation calculations
start (int) – The starting frame of the calculations
stop (int) – The stopping frame of the calculations
- Returns
A
pd.DataFramewhich has the pair correlations of all the ligands
-
MDSimsEval.rmsf_analysis.create_bar_plots_avg_stde(analysis_actors_dict, dir_path, top=50, start=0, stop=2500)¶ The method will create two plots (one for the agonists and one for the antagonists). The plot will have the avg rmsf per residue and the standard error of the mean. The color of the bars of the top-k
|agon_rmsf_avg - antagon_rmsf_avg|RMSF residues are plotted in a different color so as to be easily distinguished.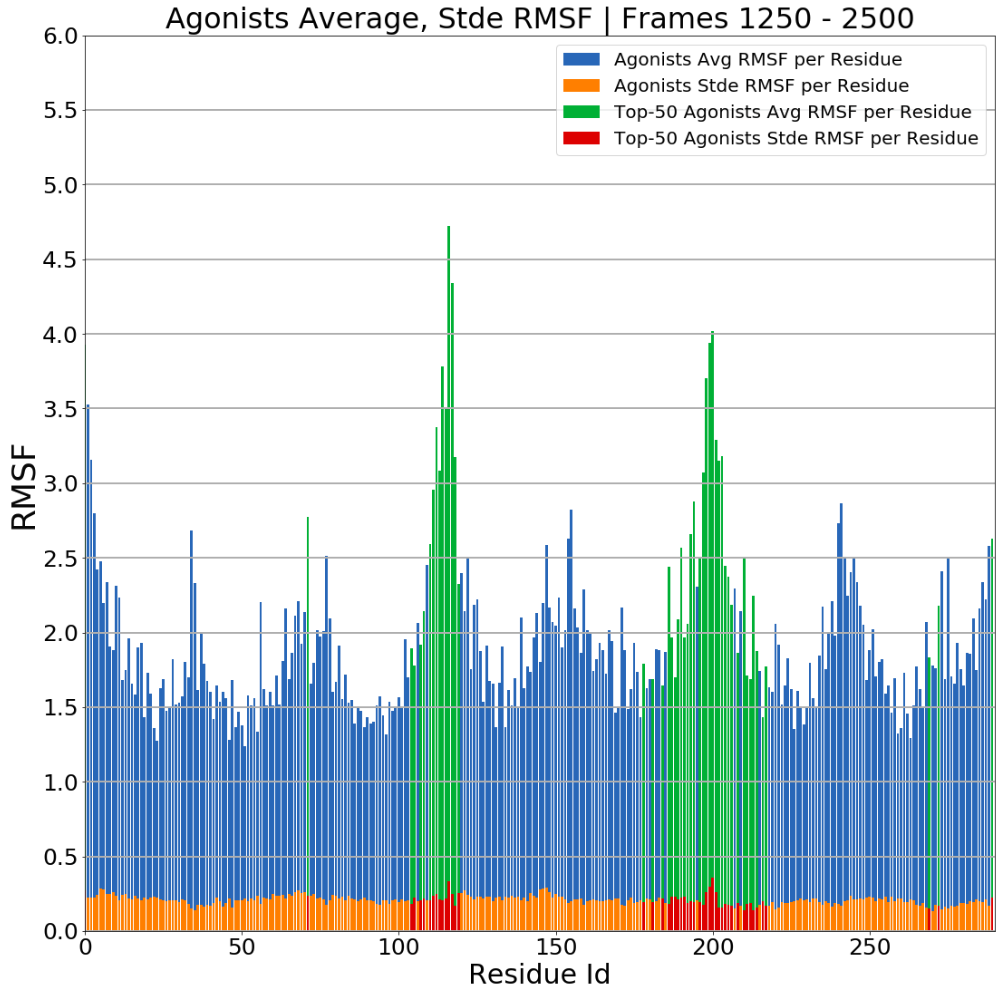
Barplots of average RMSF per residue, click for higher resolution.
- Parameters
analysis_actors_dict –
{ "Agonists": List[AnalysisActor.class], "Antagonists": List[AnalysisActor.class] }dir_path (str) – The path of the directory the plot will be saved (must end with a
/)top (int) – The top-k residues that will be plotted with a different color
start (int) – The starting frame of the calculations
stop (int) – The stopping frame of the calculations
-
MDSimsEval.rmsf_analysis.find_high_k(analysis_actors_dict, start=0, stop=2500, k=10, rmsf_cache=None)¶ Returns two DataFrames for each class with the residues that had the highest average RMSF on the specified window.
- Example:
from MDSimsEval.utils import create_analysis_actor_dict
from MDSimsEval.rmsf_analysis import find_high_k

analysis_actors_dict = create_analysis_actor_dict('/path_to_dataset/') # Read Agonists/Antagonists

agon_df, antagon_df = find_high_k(analysis_actors_dict, 500, 1000, 20, None)

# Printing the DataFrame of the residues that had the highest average RMSF across the agonists
print(agon_df)
    ResidueId     RMSF Res Name
0       116.0  3.63539      ARG
1       117.0  3.31561      PHE
2         0.0  3.01161      THR
3       200.0  2.86724      ARG
4       199.0  2.84393      CYS
5       114.0  2.78910      HIE
6         1.0  2.78634      HIE
7       198.0  2.76465      LEU
8         2.0  2.47342      LEU
9       203.0  2.44867      GLN
10      115.0  2.41584      SER
- Parameters
analysis_actors_dict –
{ "Agonists": List[AnalysisActor.class], "Antagonists": List[AnalysisActor.class] }start (int) – The starting frame of the calculations
stop (int) – The stopping frame of the calculations
k (int) – The number of the top residues that will be included in the returned DataFrame
rmsf_cache – Dictionary with key
ligand_name_start_stopand value the RMSF run result. If set toNoneno cache will be kept
- Returns
A tuple of 2
pd.DataFrame['ResidueId', 'RMSF', 'Res Name']of the high-k residues, where onRMSFcolumn we have the residues with the highest average RMSF. The first DataFrame is for the 1st class (in our case Agonists and the second one for the 2nd class (in our case Antagonists).
-
MDSimsEval.rmsf_analysis.find_top_k(analysis_actors_dict, start=0, stop=2500, k=10, rmsf_cache=None)¶ Returns a DataFrame with the residues that had the biggest absolute difference between agonists and antagonists on their average RMSF [
abs(agon_avg_rmsf_per_residue - antagon_avg_rmsf_per_residue)].- Parameters
analysis_actors_dict –
{ "Agonists": List[AnalysisActor.class], "Antagonists": List[AnalysisActor.class] }start (int) – The starting frame of the calculations
stop (int) – The stopping frame of the calculations
k (int) – The number of the top residues that will be included in the returned DataFrame
rmsf_cache – Dictionary with key
ligand_name_start_stopand value the RMSF run result. If set toNoneno cache will be kept
- Returns
A
pd.DataFrame['ResidueId', 'RMSF', 'Res Name']of the top-k residues, where onRMSFcolumn we have absolute difference.
-
MDSimsEval.rmsf_analysis.get_avg_rmsf_per_residue(ligand)¶ Having the series of resnumbs eg [1, 1, 1, 2, 2, …, 290, 290] and their respective RMSF create buckets (each bucket represents a residue) and calculate the average RMSF of each residue
- Parameters
ligand (AnalysisActor.class) – The AnalysisActor object on which we have calculated the RMSF
- Returns
The average RMSF of each residue
- Return type
ndarray[#unique_resnumbs]
-
MDSimsEval.rmsf_analysis.reset_rmsf_calculations(analysis_actors_dict, start, stop, cache=None)¶ Resets the RMSF calculations of all the ligands in the
analysis_actors_dictand recalculates them on the given window.This function could be part of the
AnalysisActorclass but in order to keep the class simple I have avoided it.- Parameters
analysis_actors_dict –
{ "Agonists": List[AnalysisActor.class], "Antagonists": List[AnalysisActor.class] }start (int) – The starting frame of the calculations
stop (int) – The stopping frame of the calculations
cache – Dictionary with key
ligand_name_start_stopand value the RMSF run result. If set toNoneno cache will be kept
-
MDSimsEval.rmsf_analysis.stat_test_residues(analysis_actors_dict, stat_test=<function ttest_ind>, threshold=0.05, start=-1, stop=-1)¶ Finds the most differentiating residues based on a statistical test on their RMSF. If
start==-1andstop==-1then we do not recalculate RMSF on the given window.For example on the T-test we have:Null Hypothesis: The RMSFs of a specific residue have identical average (expected) valuesWarning
I suggest firstly using the Bootstrapped RMSF Analysis which provides a more time consuming but also more generalized way of finding the most significant residues.
- Parameters
analysis_actors_dict – :
{ "Agonists": List[AnalysisActor.class], "Antagonists": List[AnalysisActor.class] }stat_test (scipy.stats) – A statistical test method with the interface of scipy.stats methods
threshold (float) – The p-value threshold of the accepted and returned residues
start (int) – The starting frame of the calculations
stop (int) – The stopping frame of the calculations
- Returns
A list of tuples of the residue ids (0-indexed) that had below the threshold p-value, the p_value. Eg
[(10, 0.03), (5, 0.042), ...]
5.2. Bootstrapped RMSF Analysis
Bootstrapped RMSF analysis aims on finding the most significant residues which their RMSF helps us differentiate our two classes. It differs from the Top and High Analysis above since it uses good data science practises to avoid overfitting and providing with an evaluation of how general enough are our results.
More on the method used to achieve this can be found on bootstrapped_residue_analysis function below.
- Example:
from MDSimsEval.utils import create_analysis_actor_dict

from MDSimsEval.rmsf_bootstrapped_analysis import bootstrapped_residue_analysis
from MDSimsEval.rmsf_bootstrapped_analysis import sensitivity_calc

analysis_actors_dict = create_analysis_actor_dict('path_to_data_directory/')

# Find the most significant residues per iteration
significant_res_per_iter = bootstrapped_residue_analysis(analysis_actors_dict, windows=[[0, 500], [500, 1000]],
                           stat_test=stats.ks_2samp, threshold=0.05, input_size=12, replacement_size=8,
                           iterations=100, replacements=1)

# Calculate the sensitivity of the residues that are significant on at least one iteration
sensitivity = sensitivity_calc(significant_res_per_iter)

# Create a histogram of the most significant residues
fig = plt.figure(figsize=(10,7))
ax = fig.add_subplot(111)

# Flatten the sets of significant residue to a single list
flat_res = [residue for iteration_residues in res for residue in iteration_residues]

plt.hist(flat_res, bins=np.arange(292))    # Hardcoded number of residues

plt.xlabel("Residue Id", fontsize=18)
plt.ylabel("Number of Appearances", fontsize=18)
plt.title("Histogram of Significant Residues on 1 - 500 OR 501 - 1000", fontsize=18)
plt.xlim(0, 291)
plt.xticks(np.arange(0, 292, 25))
plt.ylim(0, 110)
ax.yaxis.grid()

plt.hlines(y=100, xmin=0, xmax=291, color='red', linestyles='dashed', label="Number of Iterations")

plt.legend()

plt.show()
Output:
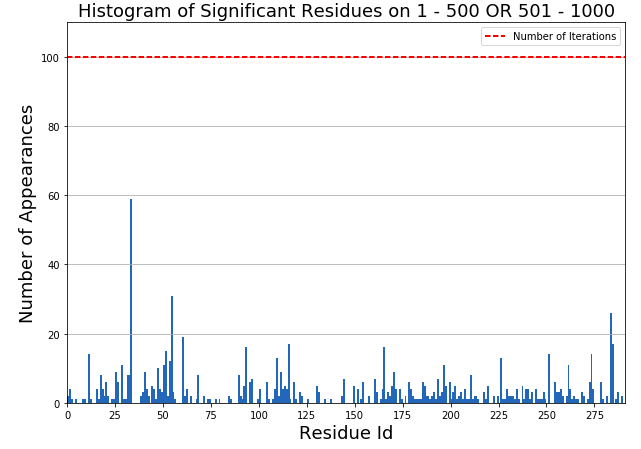
Histogram of significant residues from bootstrapped method
-
MDSimsEval.rmsf_bootstrapped_analysis.bootstrapped_residue_analysis(analysis_actors_dict, start, stop, stat_test, threshold, samples_numb, sample_size, rmsf_cache=None)¶ Generate
samples_numbrandom samples that each one will havesample_sizeagonists andsample_sizeantagonists. Then perform a statistical test on the RMSFs of each residue of the agonists vs the RMSFs of each residue of the antagonists. If the difference is significant save the residue as important for the specific iteration.Finally, return the significant residues on each iteration
- Parameters
analysis_actors_dict –
{ "Agonists": List[AnalysisActor.class], "Antagonists": List[AnalysisActor.class] }start (int) – The starting frame of the calculations
stop (int) – The stopping frame of the calculations
stat_test (scipy.stats) – A statistical test method with the interface of scipy.stats methods
threshold (float) – The p-value threshold of the accepted and returned residues
samples_numb (int) – How many random samples will be generated
sample_size (int) – How many ligands each sample will have of each class. Eg if
sample_size=10then each sample will have 10 agonists and 10 antagonistsrmsf_cache – Dictionary with key
ligand_name_start_stopand value the RMSF run result. If set toNoneno cache will be kept
- Returns
A list of
samples_numbsets. Each sets contains theResidueIdof the residues that were significant on the specific iteration
-
MDSimsEval.rmsf_bootstrapped_analysis.create_correlation_df(analysis_actors_dict, residue_ids, method, start, stop, rmsf_cache=None)¶ Creates a
numb_of_ligands x numb_of_ligandsdataframe which has the pair correlations calculated on the rmsf of the givenresidue_ids.The result is not in a readable format and could be passed in
MDSimsEval.utils.render_corr_df.- Parameters
analysis_actors_dict –
{ "Agonists": List[AnalysisActor.class], "Antagonists": List[AnalysisActor.class] }residue_ids – List of residue ids that we want the correlation on
the top-k (Eg) –
high-k –
statistically significant. (most) –
method (str) – pearson, kendall, spearman
start (int) – The starting frame of the calculations
stop (int) – The stopping frame of the calculations
rmsf_cache – Dictionary with key
ligand_name_start_stopand value the RMSF run result. If set toNoneno cache will be kept
- Returns
A
pd.DataFramewhich has the pair correlations of all the ligands
-
MDSimsEval.rmsf_bootstrapped_analysis.find_rmsf_of_residues(analysis_actors_dict, which_residues, start, stop, rmsf_cache)¶ This method finds and returns the RMSFs of each agonist and antagonist of the input residues.
- Parameters
analysis_actors_dict –
{ "Agonists": List[AnalysisActor.class], "Antagonists": List[AnalysisActor.class] }which_residues – List of residue ids that we will return their RMSF value
start (int) – The starting frame of the calculations
stop (int) – The stopping frame of the calculations
rmsf_cache – Dictionary with key
ligand_name_start_stopand value the RMSF run result. If set toNoneno cache will be kept
- Returns
An
ndarrayof shapenumb_of_agonist + numb_of_antagonists, which_residues_lengthcontaining the RMSF of each ligand of the input residue ids
-
MDSimsEval.rmsf_bootstrapped_analysis.initialize_pools(ligands_list, total_ligands=20, set_ligands=12)¶ Inputs a list of
MDSimsEval.AnalysisActorobjects and returns initial input and replacement sets of the given size.- Parameters
ligands_List – List of
MDSimsEval.AnalysisActorobjectstotal_ligands (int) – How many ligands will be used in the experiment (input + replacement sets sizes)
set_ligands (int) – How many ligands will be on the initial input set. The rest of them will be on the
set (replacement) –
- Returns
- Tuple of (List of
MDSimsEval.AnalysisActorthat will be our initial input set,List ofMDSimsEval.AnalysisActorthat will be our initial replacement set)
-
MDSimsEval.rmsf_bootstrapped_analysis.minimal_stat_test(agonists, antagonists, stat_test, start, stop, threshold=0.05, cache=None)¶ Inputs a list of agonists and a list of antagonists and finds the most significant residues. We do not return the p_value but only the residue ids.
Note
RMSF calculations are cached to avoid recalculating them. In order to use the caching mechanism we give as an argument an empty dictionary
{}.- Parameters
agonists – List of
MDSimsEval.AnalysisActoragonistsantagonists – List of
MDSimsEval.AnalysisActorantagonistsstat_test (scipy.stats) – A statistical test method with the interface of scipy.stats methods
start (int) – The starting frame of the calculations
stop (int) – The stopping frame of the calculations
threshold (float) – The p-value threshold of the accepted and returned residues
cache – Dictionary with key
ligand_name_start_stopand value the RMSF run result. If set toNoneno cache will be kept
-
MDSimsEval.rmsf_bootstrapped_analysis.plot_hists_summary(bootstrapped_results, residue_numb, dir_path, top_k=50)¶ Plots a histogram which summarizes which residues were found significant and on how many samples on each window. The colors go from black (1st window) to yellow (5th window). In case of a residue being important on more than 1 window, the bars are stacked in chronological order (from the earlier windows to the later ones). The height of the bars shows the number of samples the residue was statistically important.
On the legend the word thresh specifies the number of samples a residue must be found significant in, in order to be included in the
top-kmost significant residues.Warning
Currently the function expects five windows of 500 frames each (0 - 500, 500 - 1000, …, 2000 - 2500).
Example
from MDSimsEval.utils import create_analysis_actor_dict
from MDSimsEval.rmsf_bootstrapped_analysis import bootstrapped_residue_analysis
from MDSimsEval.rmsf_bootstrapped_analysis import plot_hists_summary

from scipy import stats
import numpy as np
import random

# Read the data
analysis_actors_dict = create_analysis_actor_dict('path_to_dataset_roor_folder')

# Do not use all the ligands so as to have a validation set
agonists_train = random.sample(analysis_actors_dict['Agonists'], 20)
antagonists_train = random.sample(analysis_actors_dict['Antagonists'], 20)

bootstrapped_results = []
for start in np.arange(0, 2500, 500):
    res = bootstrapped_residue_analysis({"Agonists": agonists_train, "Antagonists": antagonists_train},
                                        start, start + 500, stats.ks_2samp, threshold=0.05, samples_numb=1000,
                                        sample_size=10)
    bootstrapped_results.append(res)

# Here it is suggested to save the bootstrapped_results on disk using pickle so as to avoid
# recalculating them

plot_hists_summary(bootstrapped_results, residue_numb=290, dir_path='path_to_save_dir/', top_k=50)
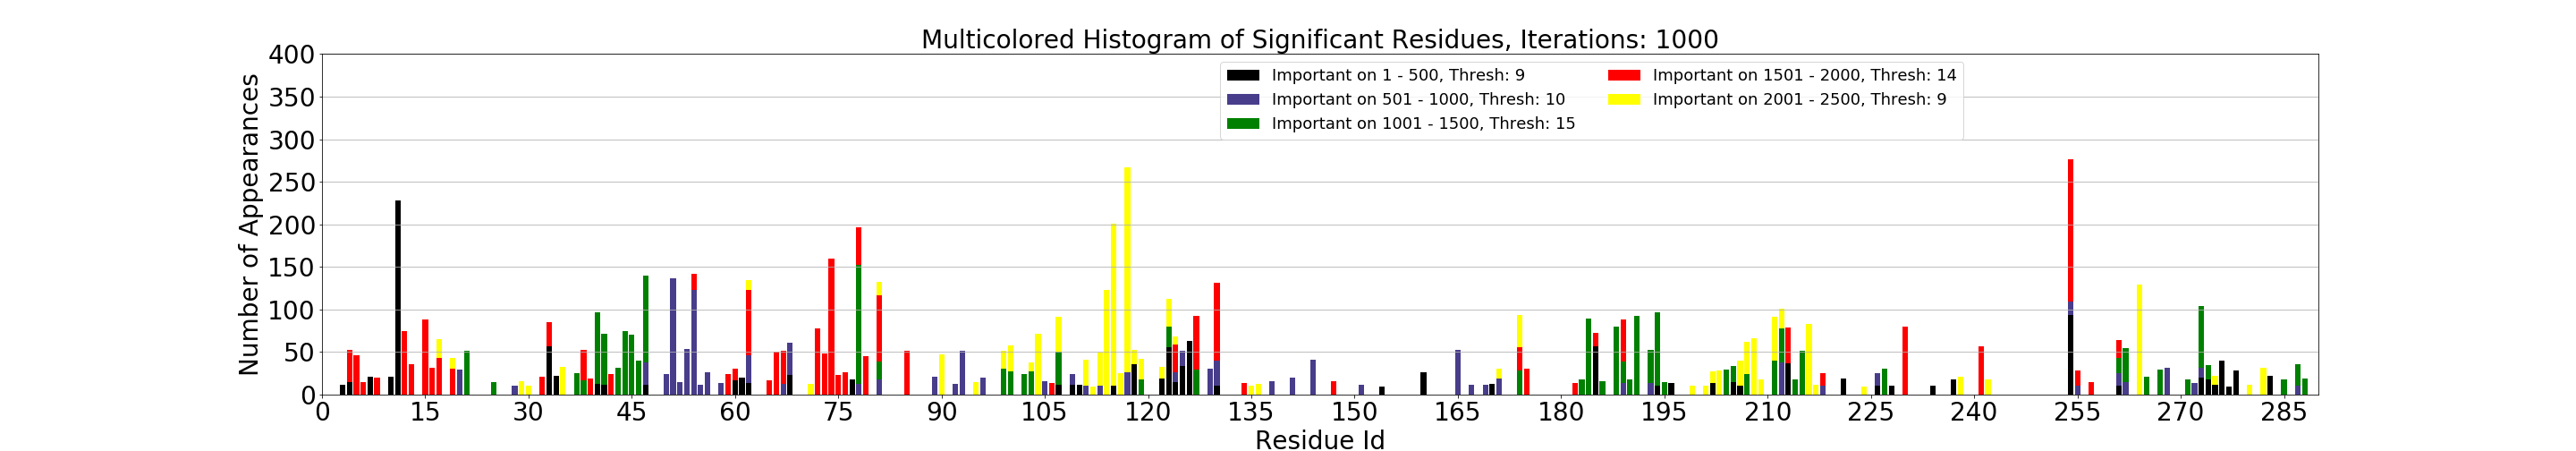
Output plot of the above script, click for higher resolution
- Parameters
bootstrapped_results – A list of bootstrapped_residue_analysis results for each window
residue_numb (int) – The total number of residues in the RMSF selection
dir_path (str) – The path of the directory the plot will be saved (must end with a
/)top_k (int) – How many residues to include in order of significance
-
MDSimsEval.rmsf_bootstrapped_analysis.replacement_swap(input_set, replacement_set, numb_of_replacements=1)¶ Performs given number of swaps between the input_set and the replacement_set.The swaps are inplace.
- Parameters
input_set – List of
MDSimsEval.AnalysisActorthat is our input setreplacement_set – List of
MDSimsEval.AnalysisActorthat is our replacement set
-
MDSimsEval.rmsf_bootstrapped_analysis.sensitivity_calc(sign_residues_per_iter)¶ - Inputs the output of
bootstrapped_residue_analysisand calculates the sensitivity of each residue.The returned sensitivity of each residue is calculated by calculatingresidue_appearances / iterations.A sensitivity of 1 is ideal meaning that the residue was significant to all the iterations.- Parameters
sign_residues_per_iter – A list of sets containing the residue ids of the significant residues on each iteration
- Returns
A dictionary of
ResidueId(key), Sensitivity(value)for all the residues that appeared at least on one iteration